Measuring and visualizing GenStage/Flow with Gnuplot
After my recent post about Elixir GenStage/Flow some people asked about follow-up on measurements and plotting, so here it is.
White lies
Before we start, I need to admit to one thing. In the last post, I’ve written that I’ve used Repo.stream from Ecto.
The truth is, I’ve used my own version
of Repo.stream that has been in Recruitee codebase long before Ecto got one. This difference will be very important
when we will talk about measuring progress.
Measuring progress
First, we need to somehow gather progress data for every stage.
Every metrics system is composed from at least these three components:
- collector
- storage (not necessarily persistent)
- events/metrics emitter (reporter)
And the one I’m going to describe, although being extremely simple is no different.
In Elixir/Erlang world it comes quite naturally that the collector could be a separate process and to emit metrics events we can send messages to that process. And for the storage part we can just use the file system.
Below is the annotated, complete source code of the progress collector, based on GenServer:
defmodule Progress do
  use GenServer

  @timeres :millisecond

  ## CLIENT API

  # Progress.start_link [:a, :b, :c]
  def start_link(scopes \\ []) do
    GenServer.start_link(__MODULE__, scopes, name: __MODULE__)
  end

  def stop do
    GenServer.stop(__MODULE__)
  end

  # increment counter for given scope by `n`
  #     Progress.incr(:my_scope)
  #     Progress.incr(:my_scope, 10)
  def incr(scope, n \\ 1) do
    GenServer.cast __MODULE__, {:incr, scope, n}
  end


  ## CALLBACKS

  def init(scopes) do
    # open "progress-{scope}.log" file for every scope
    files = Enum.map(scopes, fn scope ->
      {scope, File.open!("progress-#{scope}.log", [:write])}
    end)

    # keep current counter for every scope
    counts = Enum.map(scopes, fn scope -> {scope, 0} end)

    # save current time
    time = :os.system_time(@timeres)

    # write first data point for every scope with current time and value 0
    # this helps to keep the graph starting nicely at (0,0) point
    Enum.each(files, fn {_, io} -> write(io, time, 0) end)

    {:ok, {time, files, counts}}
  end

  def handle_cast({:incr, scope, n}, {time, files, counts}) do
    # update counter
    {value, counts} = Keyword.get_and_update!(counts, scope, &({&1+n, &1+n}))

    # write new data point
    write(files[scope], time, value)

    {:noreply, {time, files, counts}}
  end

  defp write(file, time, value) do
    time = :os.system_time(@timeres) - time
    IO.write(file, "#{time}\t#{value}\n")
  end
end
In short, the progress process opens a separate log file for every scope given,
saves the time of own start and for every :incr message writes a new line into a related file.
We keep the files open to avoid opening it for every event (which would be much slower).
Since it is a separate process, that is stopped after processing is finished,
we don’t really have to care about closing open files - every file handle
is actually another separate process,
linked to the process that originally opened it, and will be closed when parent
process terminates.
In order to emit metrics events I had to modify stages functions with calls to Progress.incr.
It was mostly straightforward, except it required a small addition
to Repo.stream code.
def select do
  build_some_query
  |> Repo.stream(chunk_size: 500, on_chunk: fn list ->
    # use `on_chunk` hook to report progress
    Progress.incr(:select, length(list))
  end)
end

def download(record) do
  file = do_the_download(...)
  # increment counter by 1 after downloading
  Progress.incr(:download)
  file
end

def extract(file) do
  text = do_the_extract(...)
  # increment counter by 1 after extracting
  Progress.incr(:extract)
  text
end

def index(texts) do
  do_the_index(...)
  # increment counter by list length
  Progress.incr(:index, length(texts))
  :ok
end
And the perform function looks like this:
def perform do
  # start progress process ...
  Progress.start_link([:select, :download, :extract, :index])

  select
  |> Flow.from_enumerable(max_demand: 100)
  |> ...
  |> Flow.run

  # ... and stop it after processing is done
  Progress.stop
end
Plotting the results
I’ve spent quite some time with various plotting options. The first version of collector simply sent all time/count data into stdout that I would select & copy. First, I’ve tried Apple Numbers, which can’t really handle more that 15 rows. Then I switched to Google Docs Spreadsheets which was surprisingly much better than Numbers, but I got tired of that copying & pasting, so I went to look for some automated solution. After digging through thousands of JavaScript graphing libraries I’ve decided to give gnuplot one more chance.
The biggest issue I have with gnuplot is that it’s a bit ugly by default, and all the examples one can find use some shorthand mnemonics that must be deciphered with trial & error.
After some time of playing with gnuplot I’ve managed to write a script that will produce exactly what I wanted:
# plot.gp
# output to png with decend font and image size
set terminal png font "Arial,10" size 700,500
set output "progress.png"
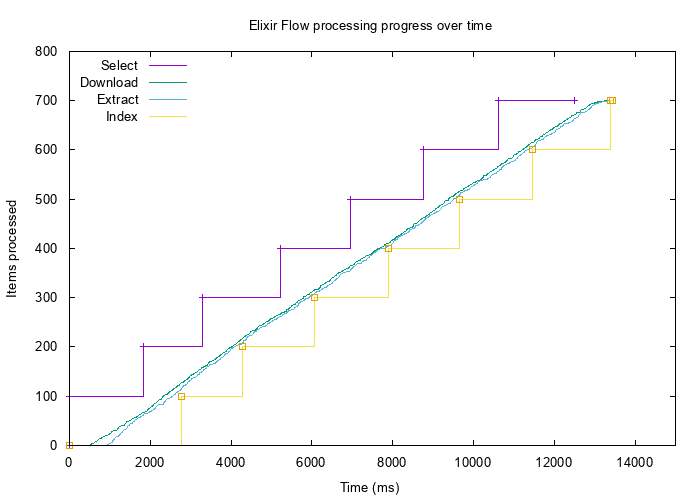
set title "Elixir Flow processing progress over time"
set xlabel "Time (ms)"
set ylabel "Items processed"
set key top left # put labels in top-left corner
# limit x range to 15.000 ms instead of dynamic one, must-have
# when generating few graphs that will be later compared visually
set xrange [0:15000]
# plot series (see below for explanation)
# plot [file] with [line type] ls [line style id] [title ... | notitle]
plot "progress-select.log" with steps ls 1 title "Select",\
"progress-select.log" with points ls 1 notitle,\
"progress-download.log" with lines ls 2 title "Download",\
"progress-extract.log" with lines ls 3 title "Extract",\
"progress-index.log" with steps ls 4 title "Index",\
"progress-index.log" with points ls 4 notitle
- SELECT and INDEX are plotted once with steps and then again with [http://stackoverflow.com/questions/16736861/pointtype-command-for-gnuplot]
- DOWNLOAD and EXTRACT are plotted with lines
- lines colors are matched using
ls(line style) setting
Then running it with
$ gnuplot plot.gp
produces:
That’s it
I think the biggest advantage of using tools like gnuplot instead of Excel/Google Docs is the mentioned automation.
Most modern image browsers can automatically reload a file when it’s changed, so you can see the data plotted almost instantly.
And as a bonus, you get .png files ready for Twitter/Blog post ;)
Looking for comments section?
Send me an email instead to [email protected]